
An operationalisation matrix is the table that turns an abstract construct named in your hypotheses — organisational resilience, dynamic capability, employee engagement — into something a survey respondent can actually answer: a conceptual definition, one or more measurable dimensions, an indicator for each dimension, and a specific item or question tied to a named scale. Below is the method and two fully worked matrices for illustrative constructs. The examples are invented; the method is the convention taught in standard management research-methods texts (Saunders, Lewis and Thornhill’s research-methods framework and Bryman and Bell’s business research methods text both describe this same conceptual-to-operational chain, though under slightly different terminology).
What operationalisation actually means, and why a hypotheses chapter alone does not do it
The site’s existing piece on research problem, questions, hypotheses and variables for a management doctorate gets a thesis as far as naming its variables — “organisational resilience,” “digital transformation readiness,” “employee engagement” — inside a testable hypothesis. Naming a variable is not the same as measuring it. Operationalisation is the deliberate, documented chain from an abstract construct to a concrete survey item, and a management PhD examiner reading the methodology chapter is checking that chain link by link: does the conceptual definition match how the construct is used in the literature review, does each dimension genuinely belong under that definition, does each indicator plausibly capture that dimension, and does each item’s wording actually ask what the indicator claims to measure.
The five columns every operationalisation matrix needs
| Column | What it answers |
|---|---|
| Construct | The abstract concept named in the hypothesis |
| Conceptual definition | The definition adopted from the literature, with its source |
| Dimension | A distinct sub-component the construct is theorised to have |
| Indicator | An observable proxy for that dimension |
| Item / measure | The exact survey question or coding rule, with its scale and source |
Worked matrix 1: organisational resilience (illustrative)
| Dimension | Indicator | Item (illustrative) | Scale |
|---|---|---|---|
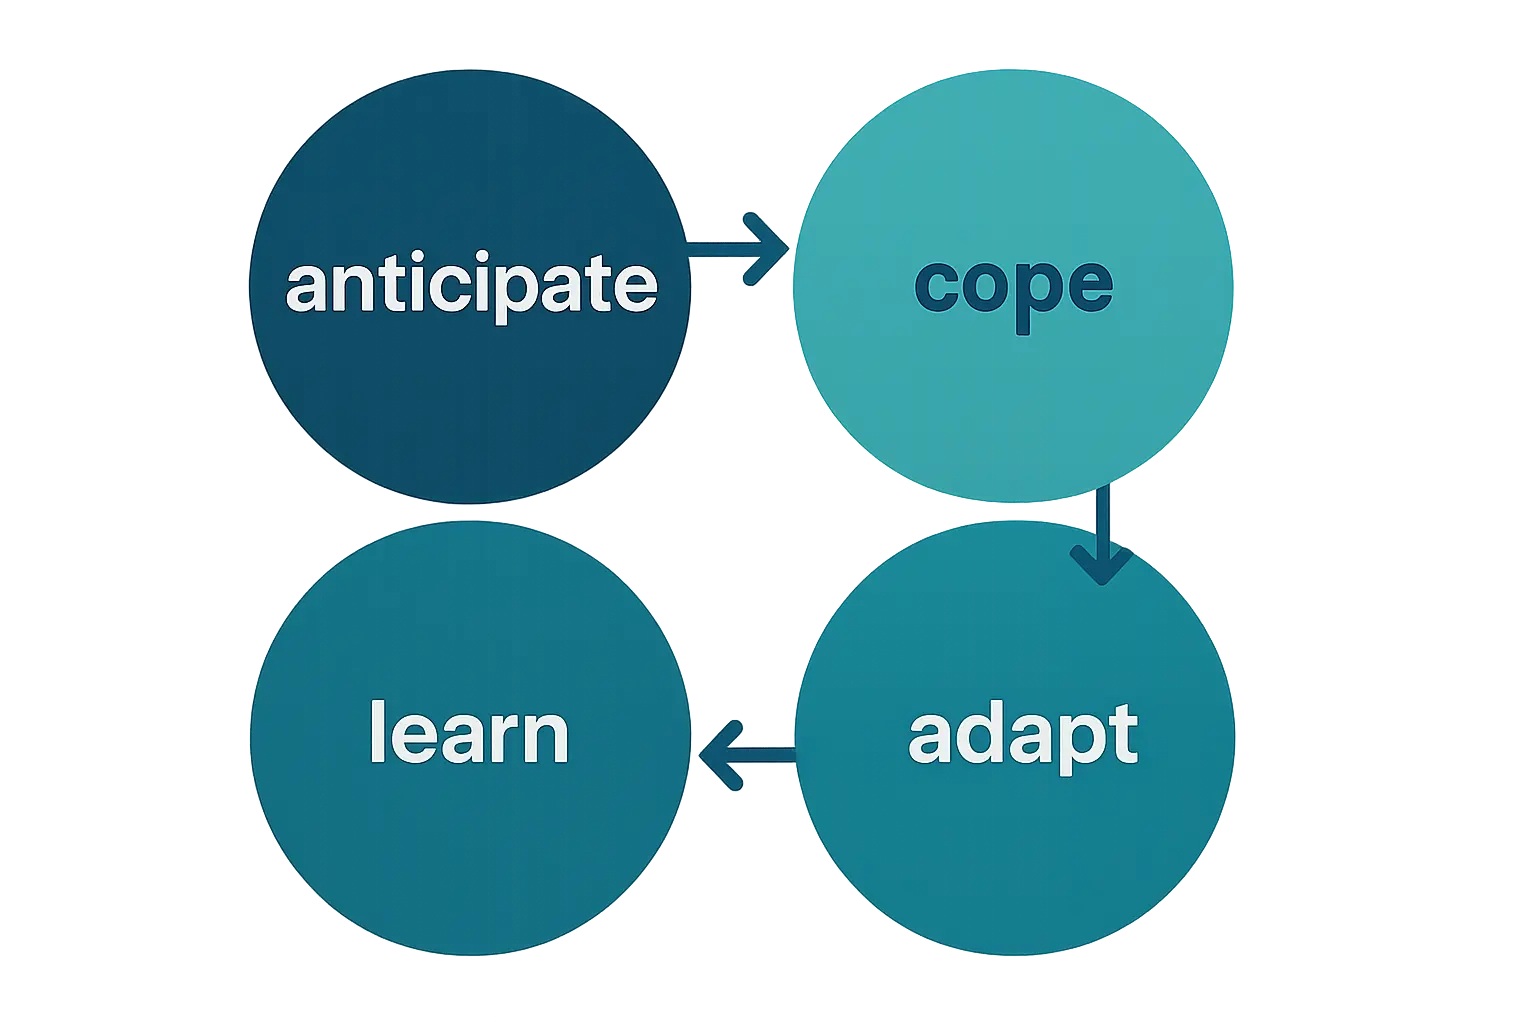
| Anticipation | Scenario-planning frequency | “My organisation regularly reviews plausible future disruptions before they occur.” | 5-point Likert, illustrative adaptation |
| Coping | Resource redeployment speed | “When a disruption occurs, my organisation can reallocate staff and budget within days rather than weeks.” | 5-point Likert, illustrative adaptation |
| Adaptation | Process-change frequency post-disruption | “My organisation changed at least one core process as a direct result of the most recent significant disruption.” | Binary + follow-up count |
| Learning | Post-incident review completion rate | “A formal review was completed and documented after the organisation’s most recent significant disruption.” | Binary, verified against organisational records where possible |
Conceptual definition, illustrative: “Organisational resilience is the capacity of an organisation to anticipate, cope with, adapt to and learn from disruptive events, drawing on the four-dimension model common in the organisational-resilience literature.” Each of the four dimensions in the matrix above traces back to a clause in that one-sentence definition — a discipline that keeps the matrix from drifting into dimensions the definition itself does not actually license. A management thesis grounded in a named theoretical tradition, such as the DBA-level industry-embedded work covered in the site’s DBA case-study piece, faces the same discipline even where the primary method is a case study rather than a survey: every claim about “resilience” observed in the case still needs a stated conceptual definition behind it.
Worked matrix 2: digital transformation readiness (illustrative)

Conceptual definition, illustrative: “Digital transformation readiness is the extent to which an organisation’s leadership commitment, workforce capability and technical infrastructure together enable it to adopt new digital processes.” Note this definition already names three dimensions inside itself — leadership, workforce, infrastructure — which is a useful test of a well-formed definition: a reader should be able to predict most of the matrix’s dimension rows from the definition sentence alone.
| Dimension | Indicator | Item (illustrative) | Scale |
|---|---|---|---|
| Leadership commitment | Budget allocated to digital initiatives | “Senior leadership has allocated a specific, protected budget line to digital transformation this year.” | Binary + amount, where disclosed |
| Workforce capability | Staff completing digital-skills training | “What proportion of staff in this department completed digital-skills training in the past 12 months?” | Percentage, self-reported by department lead |
| Technical infrastructure | Legacy-system dependency | “How many core business processes still depend on a system the organisation classifies as legacy?” | Count, verified against IT asset register where possible |
Step 1: Fix the conceptual definition before building anything else
The most common failure examiners flag is a matrix built before the conceptual definition is settled — dimensions and items get added because they are measurable, not because the definition requires them. Settling the definition first, and writing it as a single citable sentence, is what lets every later column be checked against it rather than invented independently. The digital-transformation-readiness definition above is a useful model precisely because its three dimensions are visible inside the sentence itself, rather than needing a separate, unconnected list.
Step 2: Derive dimensions from the definition, not from an available questionnaire
A dimension belongs in the matrix only if the conceptual definition implies it. A common shortcut — starting from an existing validated questionnaire and reverse-engineering dimensions to match its items — inverts the correct order and risks measuring what an instrument happens to ask rather than what the construct’s own definition requires.
Step 3: Write indicators that are genuinely observable, not restated dimensions
An indicator has to be something that could, in principle, be observed or counted — “scenario-planning frequency” is observable; “a culture of anticipation” is not, it is simply the dimension repeated in different words. Where a dimension resists being turned into an observable indicator, that is usually a sign the dimension itself is still too abstract and needs a further step of specification before it reaches the matrix. In the digital-readiness matrix, “legacy-system dependency” works as an indicator precisely because it can be counted from an IT asset register; “a modern technical culture” would not, for the same reason.
Step 4: Choose items from a validated source where one exists, and say so
Where a validated scale already exists for a dimension, adapting its items (with the adaptation clearly flagged, as in both worked matrices above) is stronger practice than writing new items from scratch, because the adapted items inherit some of the original scale’s established reliability evidence — the same logic the site’s piece on comparing validated psychological instruments applies to choosing between PHQ-9, GAD-7, DASS-21 and WEMWBS rather than writing a new wellbeing scale from scratch. Where no validated scale exists for a genuinely novel dimension — digital transformation readiness is recent enough that fully validated, widely accepted scales are still less established than for older constructs like job satisfaction — new items need their own pilot-testing and reliability check (commonly Cronbach’s alpha for a multi-item Likert dimension) before they are used in the main data collection.
Step 5: Keep a visible audit trail from item back to definition
The matrix itself is the audit trail — a methodology chapter that includes the full matrix, rather than only prose describing “items adapted from the literature,” gives an examiner a single artefact to check every measurement decision against. This is also the artefact a supervisor or upgrade panel most often asks to see directly, rather than inferring it from scattered mentions across the methodology chapter.
How this differs from a qualitative thesis’s equivalent step
A qualitative management thesis does not build this matrix in the same form, but faces an analogous discipline: a coding framework that traces each code back to a defined construct or sensitising concept, rather than codes accumulating ad hoc during analysis. The logic — definition first, then a documented, checkable chain to the concrete unit of analysis — is the same; only the units change, from survey items to codes.
What examiners actually do with the matrix at viva
A common viva question in a quantitative management thesis is some version of “why this indicator, and not another one, for this dimension” — a question the matrix itself is built to answer if the candidate can point to the chain from definition through dimension to indicator rather than defending the item in isolation. Candidates who treat the matrix as a working document throughout the candidature, revisiting it whenever the literature review shifts, generally find this question far easier to answer than candidates who built the matrix once, early, and never returned to it as their own understanding of the construct developed.
Frequently asked questions
Are the organisational resilience and digital transformation matrices above from real, published studies?
No. Both definitions, dimensions, indicators and items are invented for illustration, though the underlying structures (the anticipate-cope-adapt-learn shape and the leadership-workforce-infrastructure shape) reflect genuinely common patterns in their respective literatures rather than being fabricated from nothing.
How is this different from the hypotheses and variables piece already on this site?
The existing piece gets a thesis to a named, testable hypothesis with named variables; this piece picks up from there and operationalises each named variable into something a survey or dataset can actually measure — a later, more granular step in the same overall chain.
Do I need a full matrix for every variable in my thesis, including control variables?
Core theoretical constructs need the full chain shown above; simple demographic or organisational control variables (firm size, sector, respondent tenure) are usually operationalised in a single line rather than a full multi-dimension matrix, since they typically map directly onto one observable item.
What if my construct genuinely has no existing validated scale?
Build items from the conceptual definition as shown in Steps 1–3, pilot them with a small sample before the main data collection, and report the pilot’s reliability statistics (commonly Cronbach’s alpha) in the methodology chapter as evidence the new items behave consistently, rather than presenting an unpiloted scale as though it were pre-validated.
Does a mixed-methods thesis need two separate matrices?
Often, yes in substance if not in format — the quantitative strand needs the item-level matrix shown here, and the qualitative strand needs the equivalent coding-framework discipline described above; a well-designed mixed-methods chapter usually presents both, showing how the two strands’ units of analysis relate to the same underlying constructs.
Should the matrix appear in the main methodology chapter or an appendix?
Convention varies, but a summary version in the methodology chapter with the full matrix in an appendix is common practice — the summary lets the reader follow the logic without breaking the chapter’s flow, while the appendix gives an examiner who wants to check every item the full detail.
Why does the digital transformation readiness example use a mix of self-reported and register-verified indicators?
Because not every dimension of a construct is equally well measured by a single method — self-report is practical for perceptions like leadership commitment, but a verifiable count (an IT asset register, a training-completion log) is stronger evidence where a genuinely objective record exists, and a well-built matrix says explicitly which kind of evidence each item relies on rather than treating all items as equally self-reported.
Can a construct’s definition predict its own dimensions, the way the digital-readiness example does?
Not always as cleanly as that example shows, but it is a useful test to aim for — if a reader cannot infer roughly what the matrix’s dimension rows will be from the definition sentence alone, the definition may need tightening before the matrix is built around it.
What is the viva question this matrix is actually preparing me to answer?
Some version of “why this indicator, and not another, for this dimension” — a question the matrix answers directly if the candidate can trace the chain from definition through dimension to indicator, rather than defending each item as an isolated choice.
Can Tesify help build a matrix like this from my own literature review notes?
Tesify’s thesis planning workflow can help structure a matrix skeleton from a construct definition and a set of candidate dimensions, though the conceptual definition itself and the judgement of which dimensions genuinely follow from it still need to come from the candidate’s own reading of the construct’s literature.