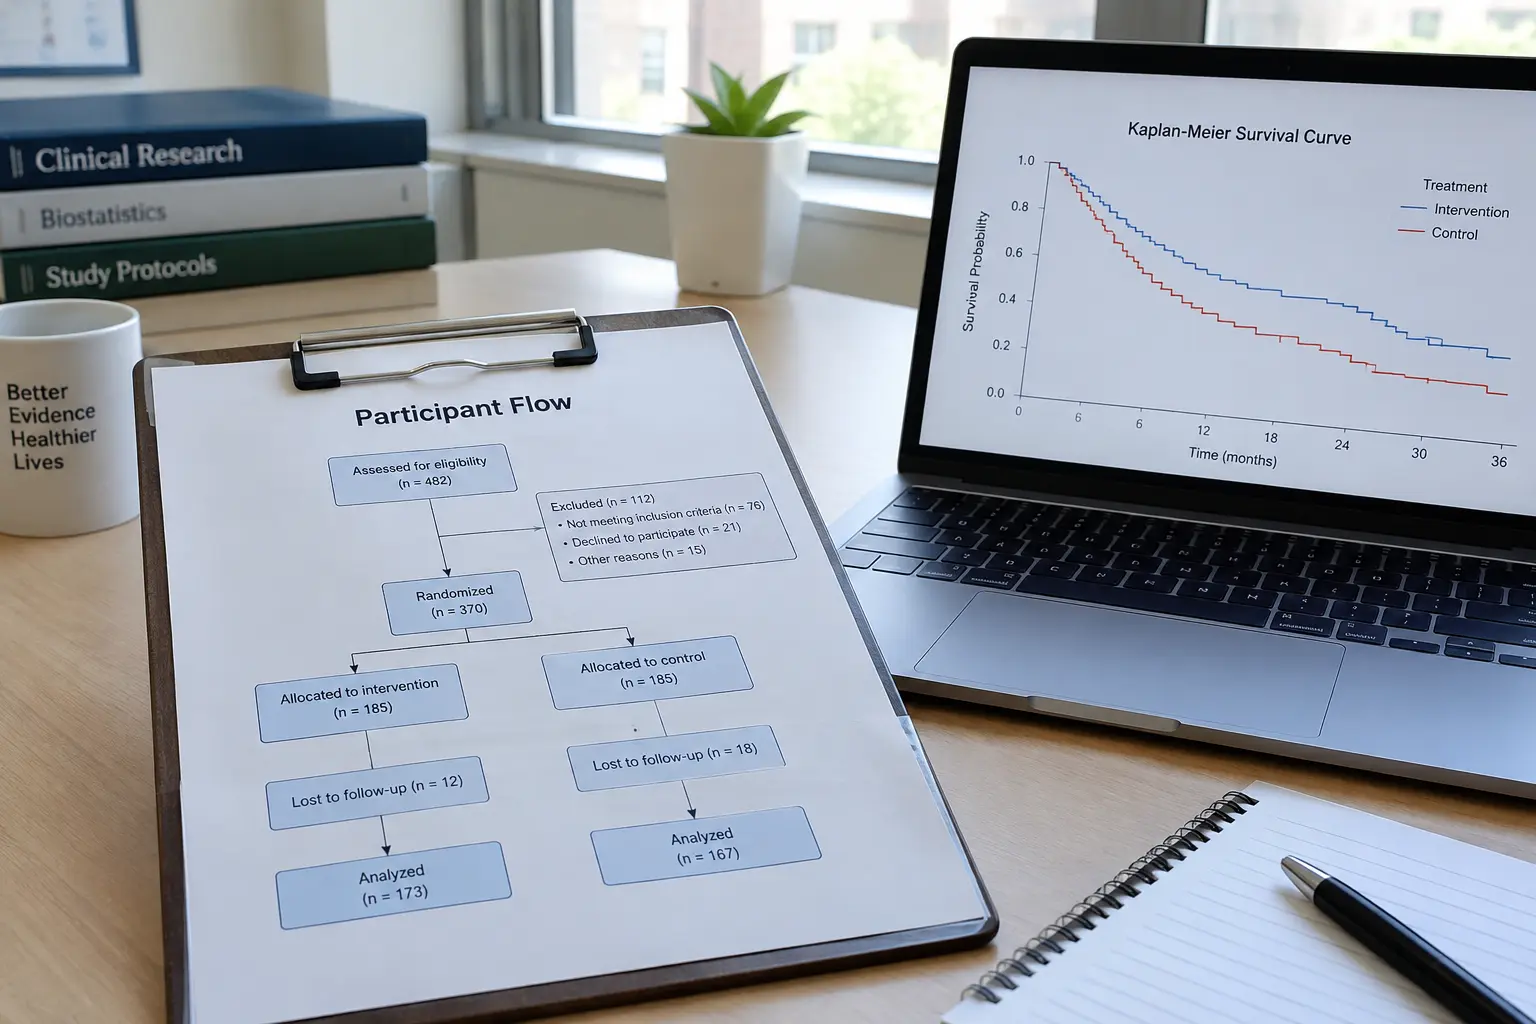
STROBE is a 22-item checklist for reporting observational studies, and its Results section runs from item 13 to item 17. Four of those items — 13 through 16 — govern the core of a cohort study’s results chapter: participant flow, descriptive characteristics, outcome data and main results, each with its own specific reporting requirement. Item 17 then covers any other analyses you ran.
| STROBE item | Covers | What it requires |
|---|---|---|
| 13 — Participants | Flow through the study | Numbers at each stage (potentially eligible, examined for eligibility, confirmed eligible, included, completing follow-up, analysed); reasons for non-participation at each stage; consider a flow diagram |
| 14 — Descriptive data | Baseline characteristics | Demographic/clinical/social characteristics, exposures and potential confounders; number with missing data for each variable of interest; follow-up time summarised (e.g. average and total) |
| 15 — Outcome data | Events over time | Numbers of outcome events or summary measures over time |
| 16 — Main results | Effect estimates | Unadjusted and, if applicable, confounder-adjusted estimates with precision (e.g. 95% CI), stating which confounders and why; category boundaries for categorised continuous variables; if relevant, absolute risk for a meaningful time period |
| 17 — Other analyses | Supplementary analyses | Other analyses done, e.g. subgroups and interactions, and sensitivity analyses |
What does STROBE actually stand for, and why does it matter for the results chapter specifically?
STROBE stands for Strengthening the Reporting of Observational Studies in Epidemiology, a 22-item checklist covering the title and abstract, introduction, methods, results, discussion and other information (such as funding) of a cohort, case-control or cross-sectional study. Items 13 to 17 sit inside the results section, with 13 to 16 covering participants, descriptive data, outcome data and main results, which means a PhD results chapter for a cohort study is not free-form — there is a defined, citable standard for what the chapter needs to contain, and an examiner familiar with epidemiological reporting will check for it whether or not the thesis names STROBE explicitly. The checklist responds to a recognised problem in the published literature: observational studies have been reported inconsistently enough that readers could not always tell what had actually been measured, on whom, or how confounding had been handled — the exact gaps the results items are designed to close.
Item 13: how do you actually report participant flow?
The checklist asks for the numbers of individuals at each stage — potentially eligible, examined for eligibility, confirmed eligible, included in the study, completing follow-up, and analysed — plus the reasons for non-participation at each stage, and asks you to consider using a flow diagram to present this. This is a distinct instrument from the PRISMA flow diagram used in a PRISMA systematic review chapter for a public health dissertation: PRISMA’s diagram tracks studies moving through a literature screening process, while a STROBE-style flow diagram tracks individual participants moving through recruitment and follow-up in a primary cohort study. Both use a similar box-and-arrow logic, but they are answering different questions and should not be conflated or mislabelled in a thesis. A well-built flow diagram is often the single figure a reader checks first, before reading a word of prose, because it tells them immediately how much of the original population survived to the final analysed sample.
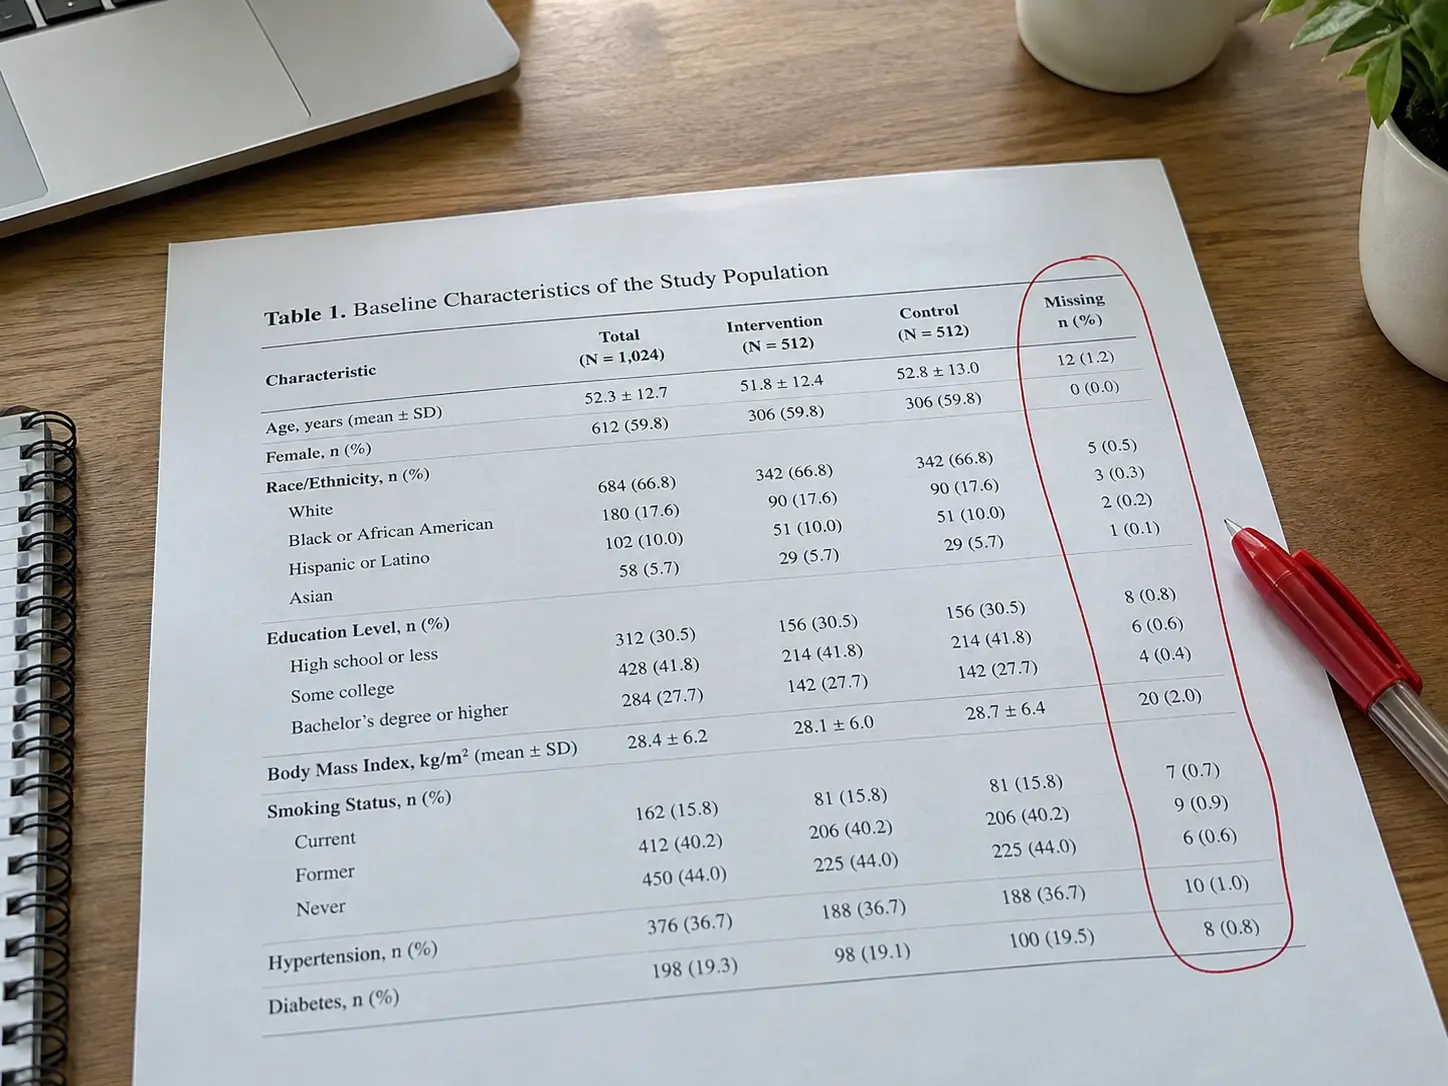
Item 14: what actually belongs in the baseline characteristics table?
Demographic, clinical and social characteristics of participants, information on exposures and potential confounders, the number of participants with missing data for each variable of interest, and a summary of follow-up time (for example, average and total amount). In practice this is the “Table 1” most epidemiology papers open their results with — and the missing-data requirement is an item theses often skip. Reporting a characteristic without also reporting how many participants had missing data for it hides exactly the kind of attrition an examiner is trained to probe for. The follow-up time summary matters for the same reason: in a cohort study, participants rarely all contribute the same length of observation, and reporting an average without a total, or a total without a sense of the spread, makes it impossible for a reader to judge how much the results might be driven by a small number of long-followed participants versus a large number of briefly observed ones. A well-organised Table 1 usually separates participants by exposure group or outcome status in adjacent columns, letting a reader compare the groups at a glance before a single inferential statistic has even been reported.
Item 15: what counts as adequate outcome-data reporting?
Numbers of outcome events or summary measures over time. For a time-to-event outcome this typically means event counts at defined follow-up points or a survival-curve summary; for a continuous outcome it means summary statistics (mean, median, standard deviation or interquartile range) at the relevant time points. The requirement is specific enough that a results chapter reporting only a final overall percentage, without any breakdown over the follow-up period, has not actually satisfied item 15. Where the outcome is rare or the follow-up period is long, a table showing event counts at intermediate time points, or a Kaplan-Meier-style survival curve, gives a reader far more information than a single end-of-study percentage — it shows whether events clustered early, accumulated steadily, or were concentrated toward the end of follow-up, each of which can point toward a different underlying mechanism worth discussing later in the thesis.
Item 16: unadjusted versus adjusted — what does a thesis actually need to show?

Both. The checklist asks for unadjusted estimates and, if applicable, confounder-adjusted estimates, each with their precision (for example, a 95% confidence interval), and asks you to make clear which confounders were adjusted for and why they were included — not the adjusted estimate alone. Showing both lets a reader see exactly how much the adjustment for confounders changed the result, which is itself part of the argument for why the adjustment was necessary. Where a continuous variable was split into categories for analysis, the category boundaries need to be reported, and where relative-risk estimates are reported, the checklist suggests considering translating them into absolute risk for a meaningful time period where relevant — a relative risk alone can overstate a genuinely small absolute effect. A worked, illustrative example (invented numbers) of what a compliant item-16 sentence looks like: “The unadjusted hazard ratio was 1.82 (95% CI 1.41–2.35); after adjustment for age, sex and baseline comorbidity, the hazard ratio was 1.34 (95% CI 1.02–1.76).” Both estimates, both confidence intervals, and the specific confounders adjusted for are all present — a sentence reporting only the adjusted figure would not meet the checklist.
Item 17: where do subgroup and sensitivity analyses go?
Item 17 asks you to report other analyses done, such as analyses of subgroups and interactions, and sensitivity analyses. In a thesis these usually sit at the end of the results chapter, after the main estimates, so the reader meets the primary answer before the checks on it. State which of these analyses were planned in advance and which were exploratory, because an examiner will read an unplanned subgroup finding very differently from a pre-specified one. A sensitivity analysis that repeats the main model under a different assumption about missing data, for example, belongs here and can be cross-referenced from the missing-data counts reported under item 14.
Where does the results chapter end and the discussion chapter begin?
STROBE’s results items govern what the results chapter reports; interpretation, comparison with prior literature, and discussion of limitations belong in the discussion chapter, which follows a different logic covered generally in how to write the discussion chapter of a PhD thesis. A common structural mistake in cohort-study theses is interpreting a result inside the results chapter itself — explaining what a hazard ratio “means clinically,” for instance — rather than reporting it there and reserving the interpretation for the discussion. STROBE has separate discussion items (key results, limitations, interpretation, generalisability); keeping that boundary clean in the thesis structure mirrors the checklist’s own logic.
How does this differ from a qualitative methodology chapter’s reporting standard?
Different field, different checklist, same underlying logic. How to write the methodology chapter of a nursing PhD thesis covers COREQ reporting for qualitative nursing research — researcher characteristics, an audit trail for how themes were derived — which answers a completely different question from STROBE’s numeric, quantitative-results requirements. A mixed-methods medical or epidemiology thesis with both a quantitative cohort component and a qualitative component may need to satisfy both checklists in different chapters, and should name each explicitly rather than applying one loosely across both.
Where does the rest of a cohort study’s data actually come from?
Where UK medical and epidemiology PhD students get their data covers the national cohorts and routinely collected datasets (UK Biobank, CPRD, HES, OpenSAFELY) a cohort study is often built on; STROBE reporting applies however the cohort was assembled, whether from a bespoke recruited sample or a secondary analysis of one of those existing resources, and the specific access route does not change what the results items ask of the chapter. A secondary analysis of an existing cohort does add one wrinkle worth stating explicitly in item 13’s participant-flow reporting: the numbers eligible and included at the point of the secondary analysis, on top of the original cohort’s own recruitment figures, since a reader needs both to judge how the analysed sample relates to the source population the original cohort was drawn from in the first place.
Frequently asked questions
What does STROBE stand for?
Strengthening the Reporting of Observational Studies in Epidemiology — a 22-item checklist for cohort, case-control and cross-sectional studies.
How many STROBE items relate directly to the results section?
Five: item 13 (participants), item 14 (descriptive data), item 15 (outcome data), item 16 (main results) and item 17 (other analyses, such as subgroup and sensitivity analyses).
Is a STROBE flow diagram the same as a PRISMA flow diagram?
No. STROBE’s diagram tracks individual participants through a primary study’s recruitment and follow-up; PRISMA’s diagram tracks studies through a literature-screening process for a systematic review. They should not be conflated.
Do I have to report both unadjusted and adjusted estimates?
Yes, per item 16 — unadjusted estimates and, where applicable, confounder-adjusted estimates, each with a precision measure, and a statement of which confounders were adjusted for and why.
What is the most commonly skipped STROBE item?
There is no official ranking, but the missing-data count within item 14 is an easily checked gap — reporting a baseline characteristic without also reporting how many participants had missing data for it.
Does STROBE apply to case-control and cross-sectional studies too?
Yes, with study-type-specific versions of the checklist for cohort, case-control and cross-sectional designs, alongside a combined version and a conference-abstract version.
Do I need to cite STROBE explicitly in my methods chapter?
It strengthens the methods chapter to name it explicitly and state which items were followed, rather than following the logic implicitly without citing the standard your reporting is actually built on.
What if my thesis has both a quantitative cohort component and a qualitative component?
Apply STROBE to the quantitative results chapter and the relevant qualitative standard (such as COREQ) to the qualitative chapter, naming each explicitly rather than blending the two loosely.
Should interpretation go in the results chapter or the discussion chapter?
The discussion chapter. STROBE’s results items cover reporting; explaining what a result means clinically or practically belongs in the discussion, and keeping that boundary clean mirrors the checklist’s own structure.
Does STROBE apply if my cohort data comes from an existing resource like UK Biobank, rather than a study I recruited myself?
Yes. The reporting requirement applies to how the results are presented regardless of whether the cohort was purpose-recruited or drawn from an existing routinely collected dataset.
Is a 22-item checklist realistic to follow for every single result in a thesis?
The results items apply structurally, to how the results chapter as a whole is organised, not item by item to every individual sentence; the discipline is in the chapter’s overall shape.
Building a results chapter examiners recognise
Following STROBE’s results items explicitly is the fastest way to make a cohort study’s results chapter recognisable to any examiner trained in epidemiological reporting. Tesify is used by 9,000+ students across 15,000+ chapters to work through exactly this kind of structured results reporting, and the thesis stays 100% written by you.