
Most accounting and finance PhD theses operationalise their core constructs through archival proxies computed from financial-statement or market data, not survey items: earnings quality is most commonly proxied by discretionary accruals from the modified Jones model (Dechow, Sloan and Sweeney, 1995, itself an extension of Jones, 1991); ESG performance is proxied by a named commercial rating — MSCI, LSEG (formerly Refinitiv) or Bloomberg’s ESG disclosure score, each of which scores differently enough that the choice has to be justified, not assumed interchangeable; and firm performance splits into accounting-based measures (ROA, ROE) and market-based measures (Tobin’s Q, cumulative abnormal returns), which frequently disagree with each other and need separate justification for which one answers the thesis’s actual research question.
Why this construct-to-measure chain looks different from a survey-based field
The site’s piece on building a variable operationalisation matrix for a management PhD works through the survey-item version of this chain — construct, conceptual definition, dimension, indicator, Likert-scale item. Most accounting and finance doctoral work instead measures its constructs from data the firm itself already reports or a third party already scores, which changes what “operationalisation” actually involves: instead of writing a survey question, the candidate is choosing between competing published proxies, each with its own known limitations, and justifying that choice against the specific research question — the same underlying discipline the site’s piece on research problem, questions, hypotheses and variables for a management doctorate asks of a candidate’s named variables, applied here to a field where the variables are measured rather than surveyed.
| Survey-based fields (e.g. management) | Archival accounting/finance research | |
|---|---|---|
| Measurement source | New or adapted survey item, self-reported | Financial statement, market data, or a third-party rating already published |
| Main methodological decision | Write or adapt the item; pilot it; check reliability (e.g. Cronbach’s alpha) | Choose between competing published models or providers; justify the choice for this sample |
| What the examiner tests at viva | Why this indicator/item for this dimension | Why this model/provider and version, not an alternative one |
| Typical data source | Primary data collected by the candidate | Compustat, Datastream, FAME, WRDS, or a rating provider’s own dataset |
Worked example 1: earnings quality via discretionary accruals
| Element | Detail |
|---|---|
| Construct | Earnings quality (specifically, the accrual-based earnings-management dimension of it) |
| Conceptual definition, illustrative | The extent to which reported earnings are managed through discretionary accounting choices rather than reflecting underlying economic performance |
| Named model | Modified Jones model (Dechow, Sloan and Sweeney, 1995), extending Jones (1991), which decomposed total accruals into current and non-current components proxied respectively by the change in revenue and by property, plant and equipment |
| What changed in the modification | Dechow, Sloan and Sweeney (1995) replaced the change in revenue with the change in revenue net of the change in receivables, on the reasoning that credit sales in the event period are more plausibly the result of earnings management than cash sales |
| Measure | Discretionary accruals: the residual from a cross-sectional or firm-specific regression of total accruals on the modified-Jones explanatory variables, with the residual’s magnitude (often unsigned, or signed depending on the hypothesis) used as the earnings-management proxy |
| Data source | Financial-statement data from a database such as those covered in the site’s accounting and finance databases comparison — Compustat, Datastream or FAME, depending on whether the sample is US, international or UK-private-company focused |
A thesis choosing this proxy has to state, explicitly, which of the six commonly cited discretionary-accruals models it is using (DeAngelo 1986, Healy 1985, Jones 1991, the modified Jones model, the industry model, or the cross-sectional Jones model of DeFond and Jiambalvo 1994) and why — examiners in this sub-field routinely ask why a candidate did not use an alternative model, and “it is the most common one” is a weaker answer than a justification tied to the specific sample (the cross-sectional and industry models, for instance, need enough same-industry firm-years to estimate reliably, which a small or specialised sample may not have).
Worked example 2: ESG performance via a named commercial rating
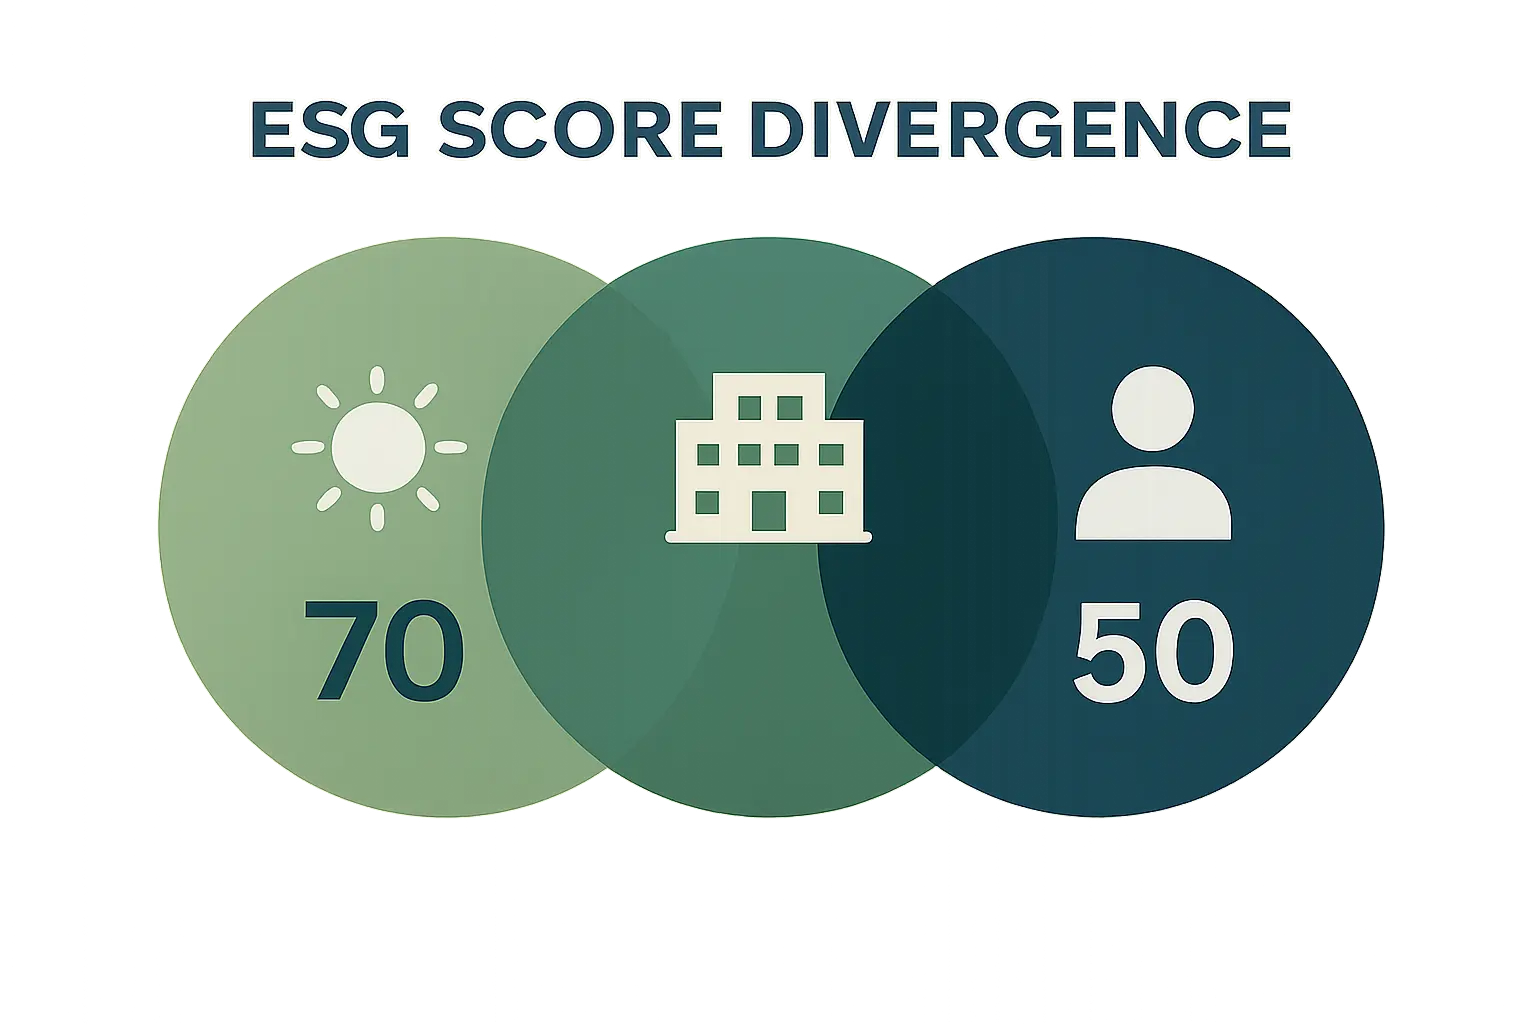
Conceptual definition, illustrative: “ESG performance is a firm’s observable environmental, social and governance conduct as scored by a third-party rating methodology.” Unlike earnings quality, where the candidate typically builds the measure from raw data, ESG performance research usually adopts an existing commercial score rather than constructing one from scratch — but the choice of provider is itself a methodological decision that needs justifying, because MSCI ESG Ratings, LSEG’s ESG Score (the renamed Refinitiv methodology) and Bloomberg’s ESG Disclosure Score do not simply relabel the same underlying data: they differ in which indicators they weight, how they handle missing disclosure, and how frequently they update, which is a widely documented source of disagreement between ESG rating providers in the finance literature. A thesis using an ESG score should state which provider, which version or methodology date, and — where feasible — test whether the main results are sensitive to the choice of provider, rather than treating “ESG score” as a single, uncontested measure.
| Dimension | What it typically captures | Provider-dependent variation |
|---|---|---|
| Environmental | Emissions, resource use, environmental opportunities | Weighting of transition risk vs current emissions differs by provider |
| Social | Labour practices, product responsibility, community relations | Coverage of supply-chain labour practices is inconsistent across providers |
| Governance | Board structure, ownership, business ethics | Board-independence definitions vary by jurisdiction and provider |
Worked example 3: firm performance, accounting-based vs market-based

Firm performance is the construct most likely to be operationalised without a single settled answer, because accounting-based and market-based measures capture genuinely different things and frequently move in different directions for the same firm-year. Return on assets (ROA) and return on equity (ROE) are backward-looking, computed from reported financial statements, and reflect realised accounting performance; Tobin’s Q (broadly, the ratio of a firm’s market value to the replacement cost of its assets) and cumulative abnormal stock returns are forward-looking or market-derived, and reflect investor expectations rather than realised results. A thesis testing whether a governance change “improves firm performance” needs to state, before running any model, which of these the hypothesis actually predicts will move, and why — a governance reform that improves investor confidence might move Tobin’s Q well before it shows up in ROA, and a thesis that reports only whichever measure happened to be significant, without having predicted it in advance, is the pattern examiners in this sub-field most often flag as a specification-search concern.
The common thread across all three: name the model, state the version, justify the choice
Across earnings quality, ESG and firm performance, the same three-part discipline applies: name the specific model or provider used (not just “discretionary accruals” or “an ESG score”), state which version or dataset vintage, and justify why that specific choice fits the thesis’s sample and research question better than the alternatives. This is the accounting and finance field’s equivalent of the construct-dimension-indicator chain the site’s management-focused matrix piece works through for survey-based research — the chain is just as real, but it runs through competing published models rather than through original survey items.
Why this discipline matters more at viva than it might first appear
An accounting or finance examiner reading a results chapter already knows the alternative models exist, and a thesis that does not address why it chose one over the others reads, to that examiner, as either unaware of the alternatives or hoping no one asks. Stating the choice and its justification inside the methodology chapter — rather than only in response to a viva question — is the difference between a candidate who anticipated the field’s standard scrutiny and one who is improvising an answer for the first time in the exam room. The same applies to reporting robustness checks: a thesis that runs the analysis with an alternative accruals model, an alternative ESG provider, or an alternative performance measure, and reports whether the result holds, pre-empts the single most predictable line of viva questioning in this sub-field.
Frequently asked questions
Is discretionary accruals the only way to measure earnings quality?
No — accrual-based earnings-management proxies are one major family; others include real earnings management measures (abnormal levels of production costs, discretionary expenses or cash flow from operations), earnings smoothness ratios, and accruals-quality measures such as the Dechow and Dichev (2002) approach based on the mapping between accruals and cash flows. The choice depends on which specific earnings-quality question the thesis is asking.
Why does the choice of ESG rating provider matter so much?
Because the providers’ underlying methodologies genuinely diverge — well-documented in the finance literature as ESG rating disagreement — so a result that holds under one provider’s score is not automatically evidence the same relationship holds under another’s, and a thesis that does not name and justify its provider leaves a reviewer unable to judge how much that choice is driving the result.
Should a firm-performance thesis just use both accounting-based and market-based measures to be safe?
Using both as robustness checks is common and often expected, but the primary hypothesis should still predict, in advance, which measure the theoretical mechanism implies will move — reporting several measures without a predicted primary one looks like searching for whichever result was significant, which is exactly the pattern examiners flag.
Do I need access to a paid database to compute discretionary accruals myself?
Usually, yes — the modified Jones model needs firm-level financial-statement time series (revenue, receivables, PP&E, total assets) that are not typically available for free at doctoral-research scale, which is why the site’s accounting and finance databases piece is the natural next step once the model is chosen.
Is it acceptable to use an ESG score without knowing exactly how the provider calculates it?
Not for doctoral-level work — the methodology document a provider publishes (even where the underlying algorithm itself is proprietary) sets out what pillars and indicators are weighted and how missing data is handled, and a thesis should read and cite that documentation rather than treating the score as a black box.
Does this archival, model-based approach apply to a qualitative accounting thesis too?
Less directly — a qualitative or interpretive accounting thesis (interview-based studies of how preparers or auditors exercise judgement, for instance) faces a different operationalisation problem closer to the coding-framework discipline described in the site’s management matrix piece, tracing codes back to defined constructs rather than choosing between competing archival models.
What is the biggest difference between this archival approach and the survey-based matrix on the management piece?
The underlying discipline (name it, define it, justify it) is identical, but the object being chosen is different — a survey-based thesis writes or adapts an item and pilots it, while an archival thesis chooses among already-existing, already-published models or ratings and justifies the choice against its own sample rather than against a new instrument’s reliability statistics.
Should a thesis report results under more than one earnings-quality model as standard practice?
It is increasingly expected as a robustness check even when the primary model is clearly justified — reviewers and examiners in accounting and finance are familiar enough with the alternative models that omitting any robustness check at all is itself often flagged, independent of which primary model was chosen.
Can Tesify help justify which measurement model fits my specific thesis?
Tesify’s thesis planning workflow can help structure the comparison of candidate models against your sample and research question, though the final justification still needs to rest on your own reading of why each model’s assumptions do or do not fit your specific data.