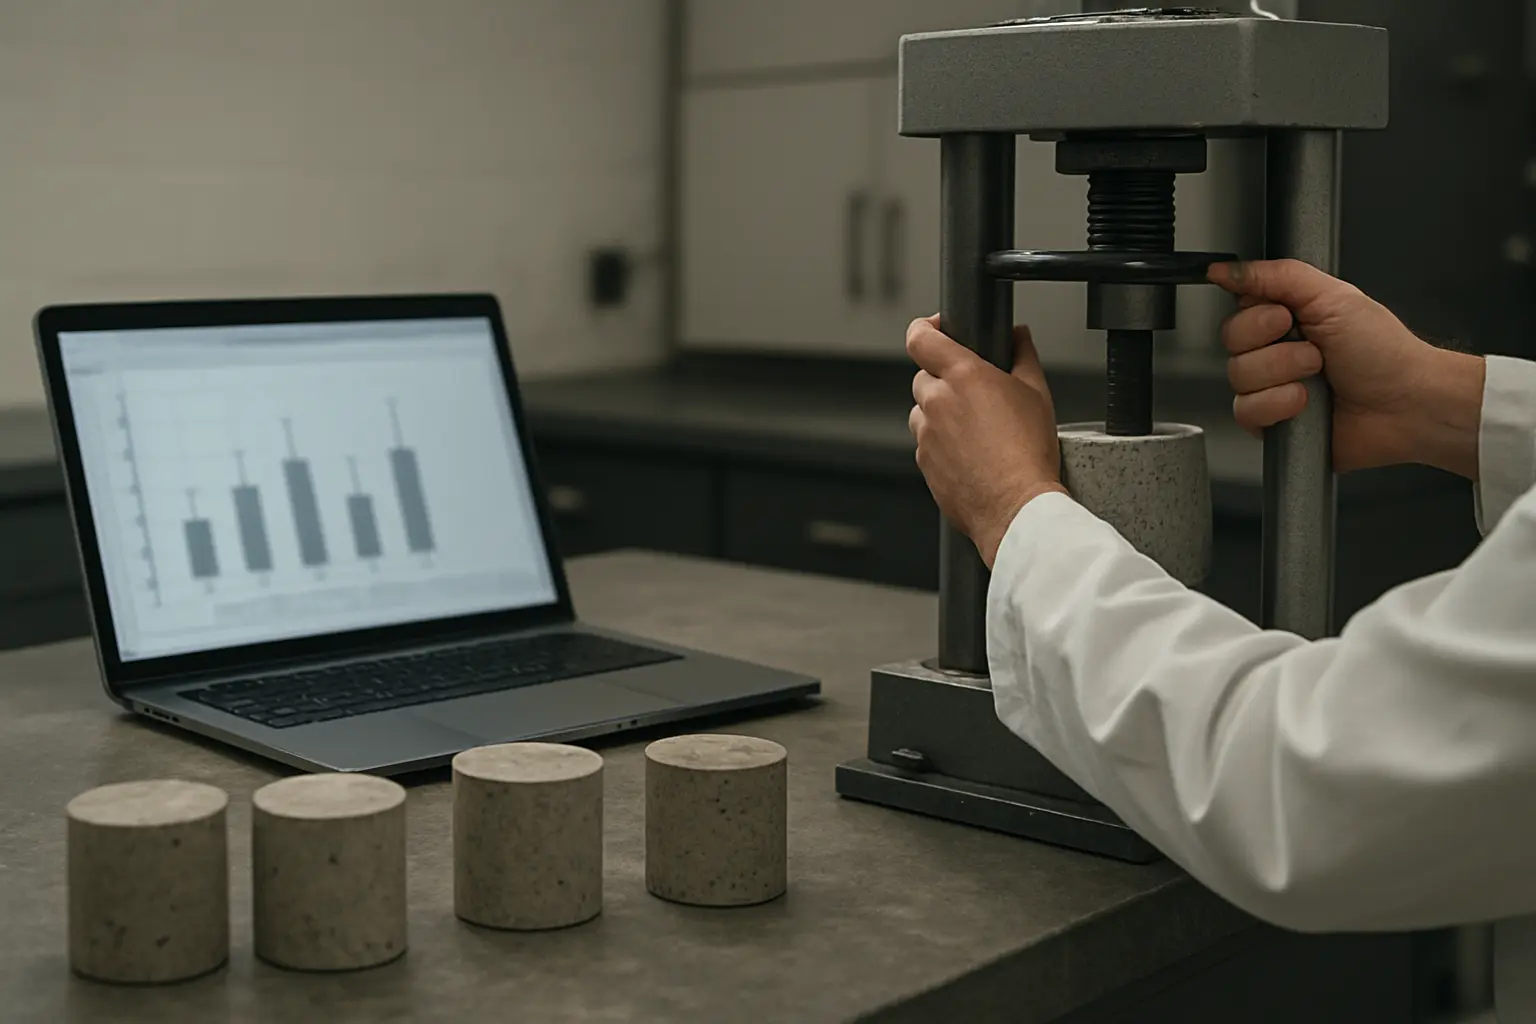
There is no single statistical test for a civil or mechanical engineering PhD thesis: the right choice depends on whether your data compares groups (ANOVA and its non-parametric alternatives), models a continuous relationship (regression and Design of Experiments), or describes time-to-failure or fatigue life (Weibull analysis) or a dynamic signal (spectral and time-series methods). Choosing the test after collecting the data, rather than during the experimental design stage, is the single most common cause of an unusable dataset in engineering doctorates.
| Data structure | Standard method | Typical engineering use |
|---|---|---|
| Comparing means across 2+ groups | t-test / ANOVA + post-hoc (Tukey, Bonferroni) | Comparing material strength across mix designs, treatments or manufacturing batches |
| Comparing means, normality violated | Mann-Whitney U / Kruskal-Wallis | Small-sample or skewed mechanical test data |
| Modelling a continuous relationship, multiple factors | Multiple regression / Design of Experiments (DOE) | Process optimisation — e.g. how mix proportions jointly affect compressive strength |
| Time-to-failure, fatigue or reliability data | Weibull analysis | Fatigue life testing, component reliability, structural durability |
| Vibration, dynamic response or sensor signals | Spectral analysis (FFT, PSD), time-series methods | Structural health monitoring, modal analysis, seismic response |
Comparing means across groups: ANOVA and its alternatives
When a thesis compares a measured outcome across two or more discrete conditions — several concrete mix designs, several manufacturing batches, several structural retrofit methods — analysis of variance (ANOVA) is the standard first choice, followed by a post-hoc test such as Tukey’s HSD or Bonferroni-corrected pairwise comparisons to identify which specific groups differ once the overall ANOVA is significant. A worked illustration, with invented sample data for this example only: a candidate comparing 28-day compressive strength across four concrete mixes with different supplementary cementitious material content, five specimens per mix, would run a one-way ANOVA on the five specimen strengths per mix; a significant F-statistic then justifies Tukey’s HSD to establish which specific mix pairs differ, rather than reporting only that “the mixes differed” without identifying where. Continuing the same invented illustration with labelled hypothetical numbers: mean 28-day strengths of 42.1, 38.6, 45.3 and 40.2 MPa across the four mixes, with standard deviations in the 2–3 MPa range typical of concrete cube testing, would very plausibly yield a significant one-way ANOVA — but the F-statistic alone does not tell you which pairs actually differ, which is precisely the question Tukey’s HSD is built to answer, and precisely the finding a results chapter needs to state explicitly rather than leaving to the reader to infer from a table of means.
Report an effect size alongside the significance test, not instead of it — eta-squared or partial eta-squared for ANOVA, Cohen’s d for a two-group comparison. A statistically significant difference in a large sample can correspond to an effect too small to matter for engineering practice, and an examiner reading a results chapter that reports only p-values, with no indication of the magnitude of the difference between mixes or treatments, will ask for it at the viva if it is missing from the thesis.
Where sample sizes are small, as is common with expensive or slow mechanical or structural tests, or where the data visibly departs from a normal distribution, the non-parametric alternatives — Mann-Whitney U for two groups, Kruskal-Wallis for three or more — test the same comparative question without the normality assumption ANOVA requires. Check and report a normality test (Shapiro-Wilk is standard) and a homogeneity-of-variance test (Levene’s) before choosing between the parametric and non-parametric route, and state that check explicitly in the methodology chapter — an examiner will ask why ANOVA was used if the reported sample size is small and no normality check is mentioned.
Sample size when specimens are expensive and slow to produce
Engineering sample-size reasoning has a practical constraint most other fields do not face in the same form: a specimen is often expensive to fabricate and slow to test to failure, so the sample-size calculation has to be weighed explicitly against what a funded studentship can actually afford to produce and test within the candidature. The same underlying power-calculation logic applies as in any other quantitative doctoral design — see how sample size is reasoned for postgraduate health research for the general framework — but an engineering thesis’s justification section additionally has to state the practical constraint driving the final number, not only the statistical one: five specimens per group is a genuinely common compromise in structural and materials testing precisely because destructive testing at scale is not affordable, and a methodology chapter that states this trade-off explicitly is more defensible at viva than one that reports a specimen count with no acknowledgment of why it stopped there.
Regression and Design of Experiments for multi-factor relationships
Where the research question is about how a continuous outcome responds to one or more continuous or categorical factors jointly — how curing temperature, water-cement ratio and admixture dosage together affect compressive strength, for instance — multiple regression or a formal Design of Experiments (DOE) approach is the correct tool, not a series of separate one-factor-at-a-time comparisons. A factorial or fractional-factorial DOE lets a thesis detect interaction effects between factors that a one-variable-at-a-time approach cannot see at all — a very common design flaw in engineering doctorates that examiners specifically probe for at viva, because it wastes specimens without answering the joint-effect question the thesis actually needs. Response surface methodology extends this further when the goal is to identify an optimum combination of factor levels, rather than simply establishing that factors matter. Fund this properly at the proposal stage: an EPSRC-funded engineering studentship’s research proposal should state the intended experimental design explicitly, because a reviewer assessing feasibility will notice a factorial design that requires far more specimens than a funded three- or four-year candidature can realistically produce — see which research council funds engineering doctoral training and at what scale for how EPSRC’s funding model compares with the other UKRI councils.
Weibull analysis for fatigue and reliability data
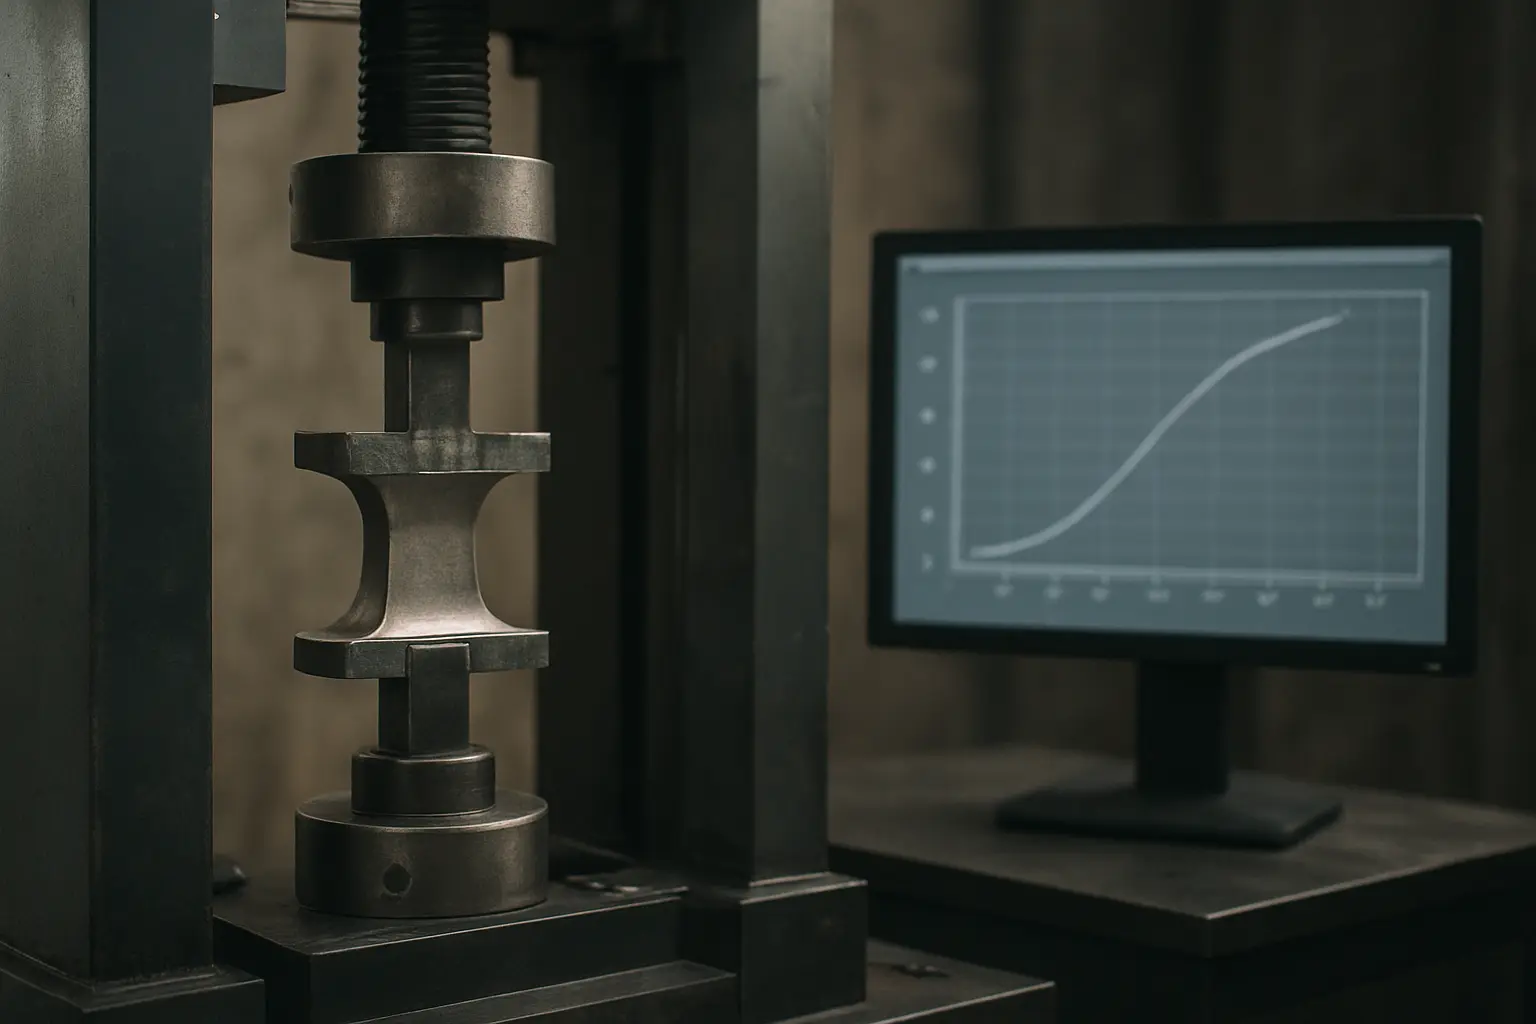
Time-to-failure data — fatigue cycles to crack initiation, component life under repeated loading, structural durability under environmental exposure — is analysed with Weibull analysis rather than ordinary means-comparison methods, because failure-time data is typically right-skewed and often includes censored observations (specimens that had not failed when testing stopped), both of which violate the assumptions behind a standard t-test or ANOVA. The two-parameter Weibull distribution’s shape parameter indicates whether the failure rate increases, decreases or stays constant with time or cycles, which is itself a substantive engineering finding, not just a statistical formality — a shape parameter above one indicates wear-out failure, which points toward a different underlying physical mechanism than a shape parameter near one, which indicates random failure independent of age. A thesis reporting fatigue data without addressing censoring explicitly, where any specimens survived to the end of testing without failing, is a common and specific gap examiners raise. Reporting convention matters here as much as the analysis itself: state the confidence interval on the Weibull shape and scale parameters, not just the point estimates, because a fatigue-life claim stated as a single number invites the examiner’s next question — how confident are you in that estimate, given the sample size actually tested.
Spectral and time-series methods for dynamic and vibration data
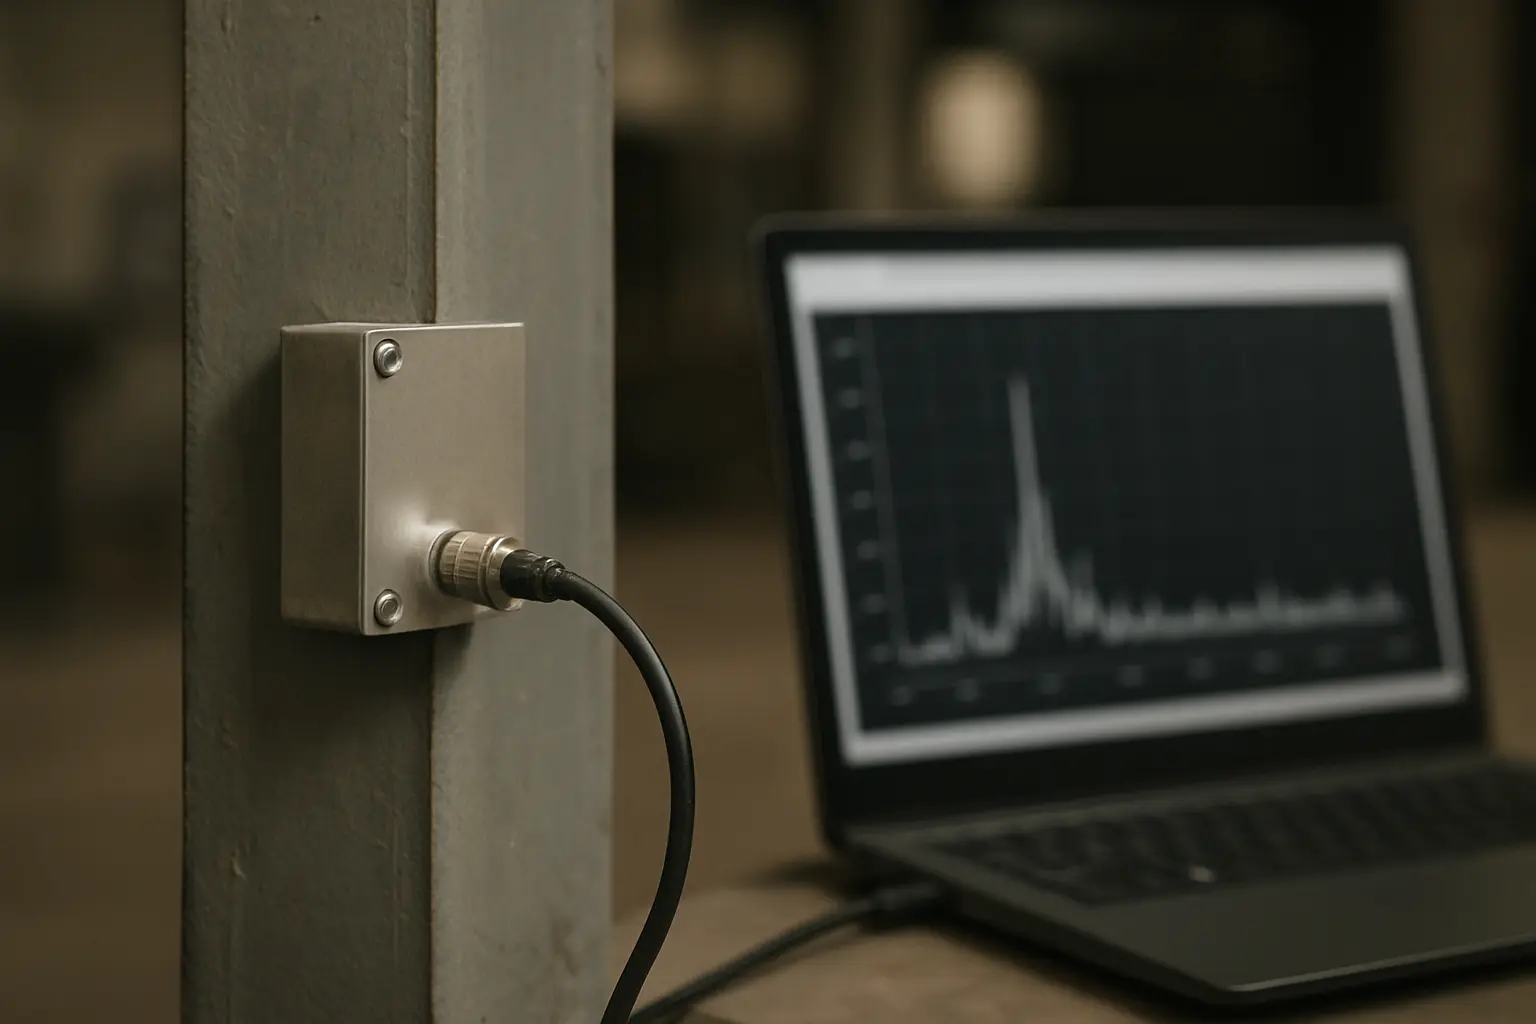
Structural health monitoring, modal analysis and seismic response research generate time-series signal data — acceleration, strain or displacement measured continuously — that summary statistics like a mean or standard deviation do not meaningfully describe on their own. Fast Fourier Transform (FFT) analysis converts a time-domain signal into its frequency-domain components, identifying the dominant vibration frequencies a structure or component exhibits; power spectral density (PSD) analysis extends this to describe how a signal’s power is distributed across frequency for signals with a stochastic or random component, such as wind or traffic loading. Choosing between a deterministic FFT and a PSD-based approach depends on whether the underlying signal is treated as repeatable and deterministic or as a random process — state this assumption explicitly in the methodology chapter, because it determines which specific technique is defensible for the data at hand. Sampling rate is the practical decision that has to be settled before data collection, not analysed around afterward: the Nyquist criterion requires a sampling rate at least twice the highest frequency of engineering interest in the signal, and a dataset collected at too low a rate cannot be rescued by any spectral method applied after the fact — decide the frequency range the research question actually needs to resolve before specifying the sensor and logger configuration, not after the monitoring campaign has already run.
Software: what your department already runs
MATLAB carries built-in toolboxes for regression, DOE, Weibull fitting and signal processing that make it the most commonly available environment in UK engineering departments, and is very often already site-licensed — check before purchasing any individual software. Minitab is widely used specifically for DOE and quality-engineering-style analysis in industry-facing engineering research, with a more guided workflow than MATLAB or R for factorial designs. R and Python both handle every method above through open-source packages and are free regardless of institutional licensing, at the cost of a steeper initial learning curve than a guided commercial tool — the same institutional-licence-first logic that applies to choosing R, Python, SPSS or Stata for a postgraduate data-science dissertation applies here: check what your department already provides before committing to a paid tool.
FAQ
Should I use ANOVA or a t-test for comparing two groups?
A t-test is sufficient for exactly two groups; use ANOVA when comparing three or more groups, followed by a post-hoc test to identify which specific groups differ.
What should I do if my engineering data fails a normality test?
Use the non-parametric alternative — Mann-Whitney U in place of a t-test, or Kruskal-Wallis in place of one-way ANOVA — rather than proceeding with a parametric test whose assumptions are violated.
Why is Weibull analysis used for fatigue data instead of a standard mean and standard deviation?
Fatigue and failure-time data is typically right-skewed and often censored, both of which violate the assumptions behind a normal-distribution-based mean and standard deviation; Weibull analysis is built specifically to handle both properties.
What does the Weibull shape parameter tell you?
Whether the failure rate increases, decreases or stays constant with time or cycles — a shape parameter above one indicates wear-out failure, distinct from random, age-independent failure.
Do I need Design of Experiments if I am only testing one factor at a time?
If your research question involves how multiple factors jointly affect an outcome, testing one factor at a time cannot detect interaction effects between factors — a full or fractional factorial DOE is needed to answer that question properly.
When should I use FFT versus power spectral density analysis?
Use FFT for a repeatable, deterministic signal; use PSD when the signal has a stochastic or random component, such as wind or traffic-induced vibration.
Is MATLAB or R the better choice for an engineering PhD?
Check your department’s existing site licence first — MATLAB is commonly already licensed in UK engineering schools, while R and Python are free regardless of institutional licensing but have a steeper initial learning curve for guided factorial-design work.
Choose the test before you design the experiment
The examples above only work as a rescue plan if the underlying experimental design already supports the intended analysis — a DOE-worthy question tested one factor at a time cannot be fixed after the fact. Tesify’s thesis writing workspace helps you draft the methodology chapter’s analysis plan against your actual research question before data collection begins, rather than after the specimens are already gone.